Help
Contents
- Genome browser
- Searching for transcripts
- Reactivity measurements
- Structure views
- Database download
- References
Genome browser
FoldAtlas includes a simple genome browser called d3nome, which shows intron and exon boundaries for each transcript, along with features that are near to the transcript of interest. This facilitates genome exploration and identification of interesting transcripts.
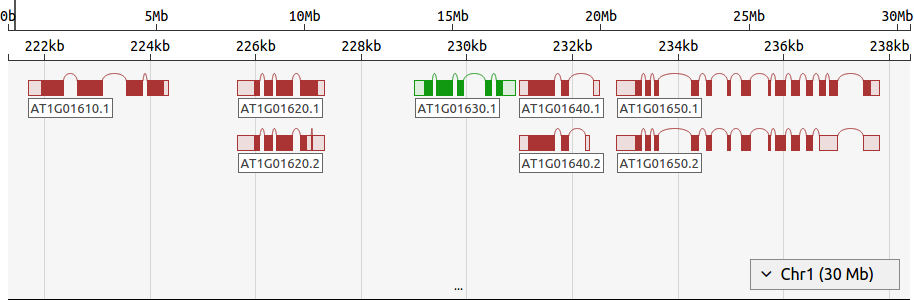
- Navigation bar: This shows the chromosome coordinates, and can be clicked and dragged to change the region of the chromosome displayed.
- Viewing area: Clicking and dragging this region will change the region of the chromosome displayed. The mouse wheel can also be used here to zoom in and out.
- Gene: Genes are marked using boxes, with curved lines indicating introns. Filled boxes indicate coding sequence (CDS), while unfilled boxes are untranslated regions (UTRs). Green genes are transcribed on the forward strand, while red genes are transcribed on the reverse strand. Clicking the gene label will show detailed information about the gene.
- Resize bar: Can be dragged downward to increase the view region.
- Chromosome selector: This menu can be used to change the chromosome displayed.
Searching for transcripts
Go to a known transcript ID
To search for a known transcript identifier (e.g. the TAIR (Lamesch et al., 2011) identifier "AT1G01010.1"), click Search in the title bar and then choose the Transcript ID tab. Next, enter the transcript ID and click Search. This will search the FoldAtlas database and jump to the profile page of the first match.
Find high coverage transcripts
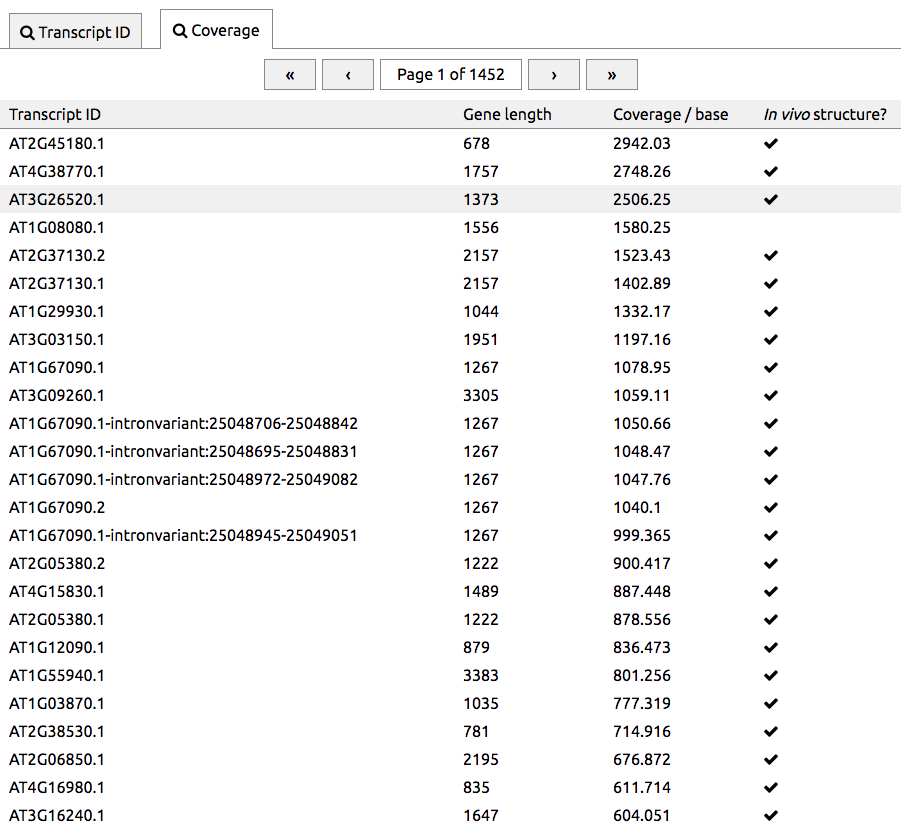
An issue with genome-scale RNA structure probing experiments is that many transcripts have only a small number of reads mapped to them, i.e. are low-coverage. We have produced an interface that lists transcripts in order of coverage. This can be reached by pressing Search and then choosing the Coverage tab. Transcripts with the best coverage are listed first, so that high-coverage transcripts can be found easily. The right column indicates transcripts whether in vivo structures are available.
Reactivity measurements
FoldAtlas includes a module that plots DMS reactivity charts and allows them to be downloaded. At present, all FoldAtlas structure probing measurements are from DMS experiments. In the future, we will also add selective 2'-hydroxyl acylation analyzed by primer extension (SHAPE) measurements.
The DMS reactivities stored in FoldAtlas are normalised as described in Ding et al. (2014), under "Methods" and "Determination and normalization of DMS reactivity".
Reactivity charts
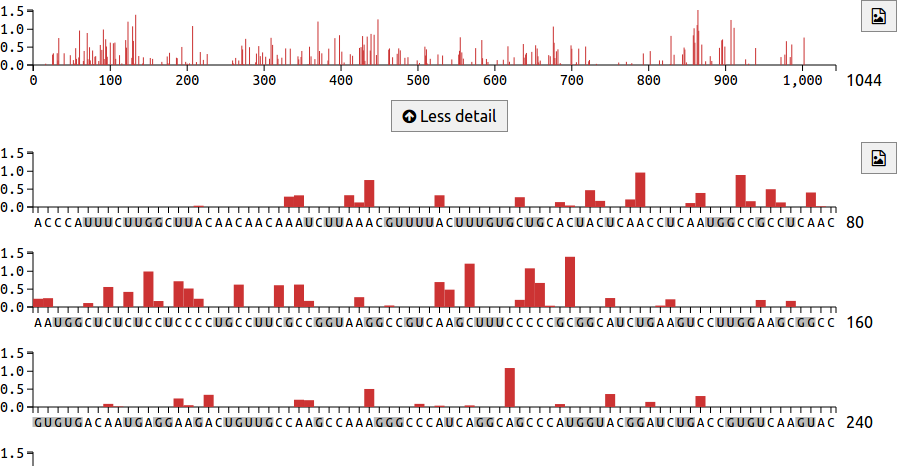
The chart area includes an overview mode, which displays reactivities for the entire transcript on a single line. This can be seen at the top of the image below. Underneath the overview is a More detail button, which shows the transcript on multiple lines, with 80 nucleotides per line. In this detailed view, G and U nucleotide labels are coloured grey to indicate that they do not react with DMS. The button downloads the reactivity chart as an SVG file.
Downloading probing data

Download Normalised can be used to obtain a tab-delimited text file containing the normalised DMS reactivity measurements for a given transcript. The following snippet illustrates 11 bases from the AT1G01620.1 transcript:
    1   2   3
    75  U   NA
    76  G   NA
    77  U   NA
    78  A   0.492188
    79  G   NA
    80  A   0.767697
    81  A   0.940973
    82  A   0.45815
    83  A   0.0
    84  G   NA
    85  A   0.823105
The columns include, from left to right:
- The nucleotide position. Numbers start from 1.
- The base type letter.
- The reactivity. 0 indicates no reactivity while 1 or more indicates the strongest reactivity. NA indicates a G or U nucleotide, where DMS reactivities are not relevant.
Download Raw can be used to obtain a text file containing raw adduct counts for DMS and control lanes, including raw counts for each replicate lane. This snippet illustrates 10 bases from the AT1G29930.1 transcript:
    1         2         3          4         5         6         7         8        9        10
    position  sequence  sum_minus  sum_plus  minus_B1  minus_B2  minus_B3  plus_B1  plus_B2  plus_B3
    1         A         3525       3179      1227      1288      1010      1192     906      1081
    2         C         4894       2620      2258      1419      1217      875      901      844
    3         C         2673       1664      1117      561       995       673      504      487
    4         C         7644       3555      2609      2570      2465      1343     1425     787
    5         A         508        402       207       181       120       124      156      122
    6         U         1981       1046      673       769       539       291      357      398
    7         U         1740       965       565       838       337       331      394      240
    8         U         1045       203       307       559       179       102      68       33
    9         C         1177       438       387       526       264       161      105      172
    10        U         288        211       84        177       27        85       82       44
The columns include, from left to right:
- position - the nucleotide position. Numbers start from 1.
- sequence - the base type letter.
- sum_minus - total count from the (-)DMS control lanes.
- sum_plus - total count from the (+)DMS lanes.
- minus_B1 - (-)DMS lane, biological replicate 1.
- minus_B2 - (-)DMS lane, biological replicate 2.
- minus_B3 - (-)DMS lane, biological replicate 3.
- plus_B1 - (+)DMS lane, biological replicate 1.
- plus_B2 - (+)DMS lane, biological replicate 2.
- plus_B3 - (+)DMS lane, biological replicate 3.
Structure views
FoldAtlas holds RNA secondary structure predictions generated using the RNAstructure package (Mathews et al., 2004). Predictions are divided into two categories: in vivo and in silico. Each structure prediction has an estimated free energy term associated, in kcal/mol.
In silico predictions
All transcript sequences have in silico structures, which have been generated from the RNA sequence alone, without constraints.
In vivo predictions
The in vivo structures have been generated by constraining the prediction method with dimethyl sulfate (DMS) reactivity values, generated in a genome-scale experiment with two rounds of poly-A selection to increase the proportion of mRNA. Constraining predictions using experimental structure probing data has been shown to improve the predictive accuracy (Deigan et al., 2008), hence in vivo predictions are inferred to be of better accuracy than their in silico counterparts.
It is important to note that not all transcripts have in vivo predictions, since many transcripts have low read sequence coverage, corresponding to low RNA abundance. The proportion of transcripts with in vivo predictions will improve in future FoldAtlas iterations, as read depth from experiments increases.
Visualising structural similarity using PCA
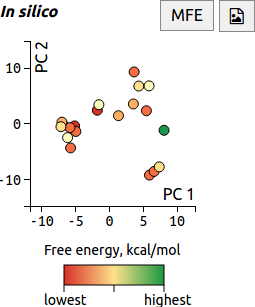
When the RNAstructure prediction method is run on a transcript, up to 20 low free-energy structures are generated. In FoldAtlas, the similarity between these structures is visualised using Principle Component Analysis (PCA). Each dot corresponds to a structure, and similar structures are located in close proximity to one another.
Clicking a dot shows detailed information about the structure. A red dot colour indicates lower free energy, i.e. a more favourable structure.
The minimum free energy (MFE) structure is visualised by default, and can be displayed by pressing the MFE button. The button downloads the PCA image as an SVG file.
The method for using PCA with RNA structures has been described in Halvorsen et al., 2010, and involves generating a vector of length n, where n is the number of nucleotides. The value at each position in the vector is set to either 0 if the corresponding base is unpaired, or 1 if paired. The vectors are then entered into the PCA method, with each vector position as a dimension.
Visualising base pairing using circle plots
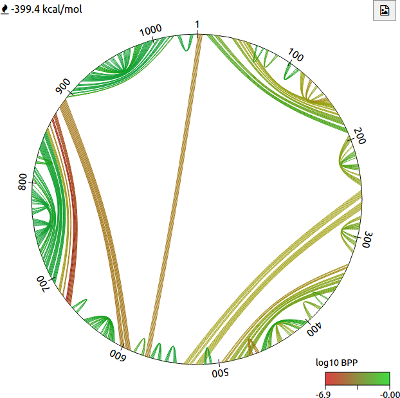
The circle plot can be used to intuitively visualise base pairing in a predicted RNA structure. Bases are arranged in a circle according to their sequence position, and lines drawn between bases indicate pairing. The colour of each line indicates the log10 base pair probability (BPP), calculated using the RNAstructure package. The free energy estimate is also shown. The button can be used to download the image as an SVG file.
Visualising structure using a fold diagram
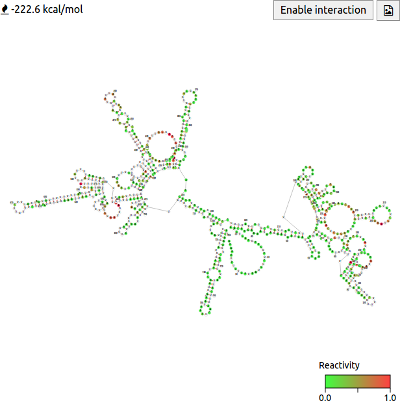
FoldAtlas also visualises structures using a fold diagram. The diagram is generated using the ViennaRNA (Lorenz et al., 2003) package and then displayed in the browser using the forna JS module. Clicking Enable interaction allows the structure diagram to be rearranged by clicking and dragging bases. A free energy estimate is displayed in the top right corner. The button downloads the image as an SVG file.
The nucleotides are coloured according to their reactivity. Green nucleotides represent weak or no reactivity, orange denotes moderate reactivity, while red indicates strong reactivity. White nucleotides indicate that reactivity is irrelevant. G and U nucleotides are always coloured white because we are displaying DMS reactivity data, and DMS only reacts with unpaired A and C nucleotides.
Structure data download

The Download structures button illustrated above generates a tab-delimited text file containing up to 20 in silico structures, along with up to 20 in vivo structures, if coverage is sufficient. The following snippet shows a single in silico structure prediction.
    >AT5G65390.1
    AAACAACUCUGCUUCACUCUCUAUCUUUCUUAAGUAAACAAAUCUUUAGAGAGAGUGGAAAAAAUGAAUUCGAAGAUCAU
    CGAAGCUUUCUUCAUCGUUGCUCUCUUCACUACCUCAUGCCUCGCUCAAGCUCCAGCUCCUUCUCCAACCACCACCGUCA
    CUCCUCCUCCCGUUGCCACUCCACCACCCGCCGCAACUCCCGCUCCGACCACCACUCCACCACCUGCCGUCUCCCCUGCC
    CCCACCUCUUCUCCUCCGUCUUCAGCUCCUUCUCCGUCGUCUGAUGCCCCUACCGCUUCUCCACCUGCACCGGAAGGUCC
    CGGAGUUAGCCCCGGCGAACUAGCCCCGACACCUUCCGAUGCUUCCGCUCCUCCACCUAACGCCGCUUUAACCAACAAAG
    CUUUCGUCGUCGGUUCACUUGUCGCCGCGAUUAUUUACGCCGUCGUGUUGGCUUAGGAUCUCAUUGUUUACAUCUUGAAA
    ACAUUAUGUUUUACAUUUUAUAGUUUCGGUGUUAAUUUCGAUAAUUUGAUUGAUUUUUCGUUAUUCGAUUGUUUACGGUG
    GAGUUAAAAUGAGAUGUUGACACGUGUAACUUUUCAUGGUUUGUUGUCUACGUGGAAUAUGUUGUGUAAAUCCAGUAAUA
    GGCUAAUAAAAUUACUUUAUUAUUCGUUCUCACAUGUUUCAUCACUCUUUUAAUAGGAAUAAAAUGUAAGAACUCAAAAA
    GAAAAUUCAUAAUUUUUAUAAAAUCAGGUAUUCUC
    >sid_207394 ENERGY:-203.0 kcal/mol  In silico structure prediction
    ...((....)).(((((((((......(((.(((.........))).))))))))))))............(((((.((.
    (((...........))).))...)))))........((((((.(((........)))........((((...........
    ...........)))).(((..((....((((.(((((....((......................))((((((.......
    ..........((((.((((..(((((............).)))).((.......))..........(((.((((((((..
    (((.(((((..........))))).)))..)))))))).)))...............((((((((((((.......))))
    .....((((.((((.........)))))))).......((((......)))).((((((............)))))).((
    (((...))))).((........))..)))))))).....(((((((.((.((((.....)))).))))))))).)))).)
    ))).......))))))..(((.((((........))))))).)))))....))))....))..))).......(((((((
    ((.((((...)))).))))))))).(((((.(((((((((...............)))))...)))).))))).......
    (((((((...)))))))........))))))....
The sequence identifier is on the first line followed by the sequence and then the structures. For each structure, the FoldAtlas structure identifier (sid_*) is shown alongside free energy and details of whether the structure is an in silico or in vivo prediction. The structure is given in dot bracket notation.
Database download
The entire FoldAtlas MySQL database can be downloaded as an SQL file by using the Download All button: The following Entity-Relationship (ER) diagram describes the FoldAtlas database:
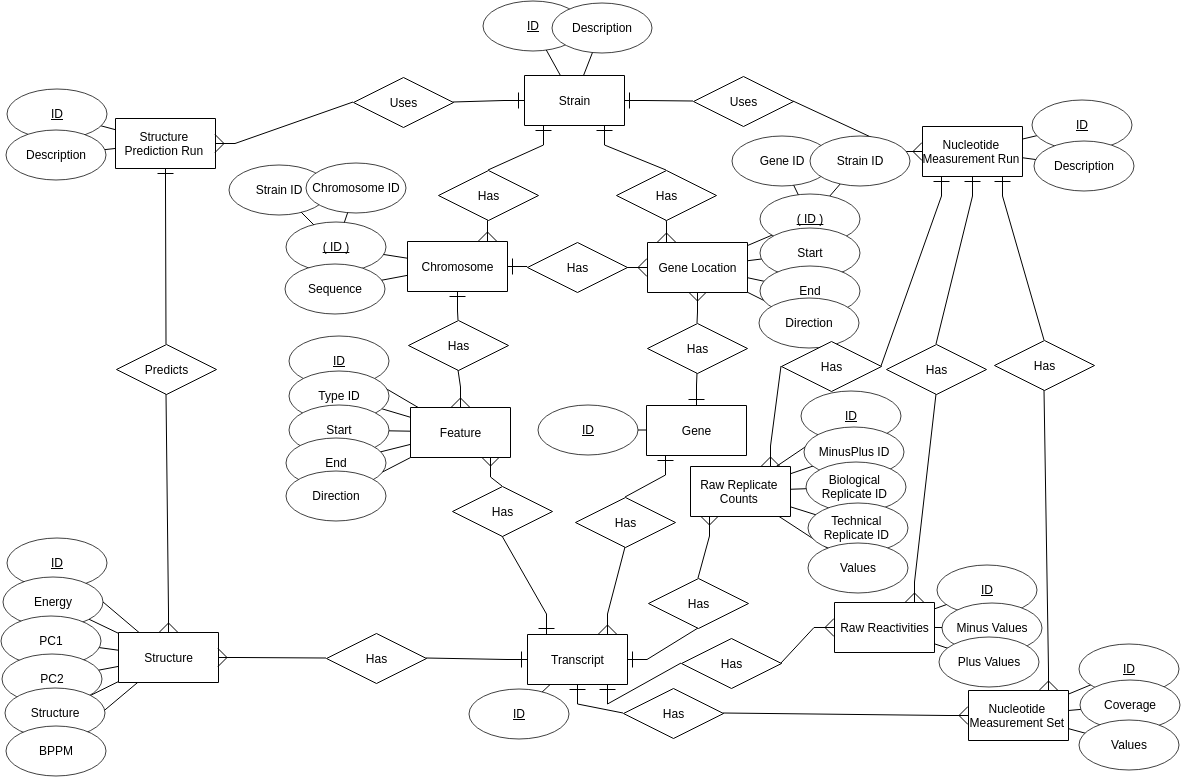
Structural entities
Structural entities include RNA structure prediction data, along with the probing data that were used to generate them.
- Structure Prediction Run: This represents an RNA structure prediction run. At present there is just one of these, generated using the RNAstructure (Mathews et al., 2004) method.
- Structure: Represents a single structure that has been predicted as part of a structure prediction run. This is generated from a single transcript sequence. Includes a free energy estimate, data for PCA plots, and a strings containing tab delimited pairing data. Another string stores base pair probabilities that correspond to the structure.
- Nucleotide Measurement Run: Represents a genome-scale experiment that involves taking measurements at specific nucleotide positions. At present this is used to represent DMS reactivity data. In the future, data from SHAPE and ribosome profiling experiments will also be represented by this entity.
- Raw Replicate Counts: This represents raw adduct counts for a single (-)DMS or (+)DMS lane, generated from mapping reads in an RNA structure-seq experiment. A text field contains the tab delimited adduct counts.
- Raw Reactivities: This contains the summed adduct counts across all replicates for (-)DMS and (+)DMS lanes.
- Nucleotide Measurement Set: Represents normalised reactivities, generated from summed adduct counts. Includes a property to store a per-nucleotide coverage value for the entire transcript, and a string containing the individual measurements.
Genomic entities
Other FoldAtlas tables deal with representing genomic data structures. These are used by the genome browser and also to generate RNA sequences. These cover gene and transcript identifiers. Genomic entities include:
- Strain: A strain represents a single sequenced accession of a particular organism. At present, the reference A. thaliana genome, Col0, is the only strain stored in FoldAtlas. Future versions of FoldAtlas will include additional strains and organisms.
- Chromosome: All FoldAtlas sequences originate from chromosome entities. Each chromosome is associated with a strain and a chromosome ID, which is a generic identifier shared across strains. The sequence property stores the entire chromosome sequence.
- Feature: A feature describes start and stop boundaries within a chromosome that correspond to coding sequences (CDSs), untranslated regions (UTRs) or introns. By combining features and chromosome sequences, it is possible to find the sequence of a transcript.
- Gene Location: A gene location contains redundant information about the start and stop boundaries of a gene with respect to the genome sequence of a particular strain. These data are used to quickly calculate gene lengths, and to visualise gene boundaries in the integrated d3nome genome browser.
- Gene: FoldAtlas gene entities are generic, i.e. are shared between different strains. A gene can therefore have multiple strain-specific locations, and can also be associated with multiple transcripts, representing alternative splice forms.
- Transcript: The transcript is a generic entity that can be shared amongst multiple strains, with the transcript sequence represented by chromosome sequence and strain-specific features that cover the chromosome sequence.
References
- Mathews, D.H. et al., 2004. Incorporating chemical modification constraints into a dynamic programming algorithm for prediction of RNA secondary structure. PNAS 101, 7287–7292. DOI
- Deigan, K.E. et al., 2008. Accurate SHAPE directed RNA structure determination. PNAS 106, 97-102. DOI
- Halvorsen, M. et al., 2010. Disease-associated mutations that alter the RNA structural ensemble. PLoS Genetics 6, e1001074. DOI
- Lorenz, R. et al., 2011. ViennaRNA Package 2.0. Algorithms Mol. Biol. 6, 26. DOI
- Lamesch, P. et al., 2011. The Arabidopsis Information Resource (TAIR): improved gene annotation and new tools. Nucleic Acids Research 40, D1202–1210. DOI
- Ding, Y. et al., 2014. In vivo genome-wide profiling of RNA secondary structure reveals novel regulatory features. Nature 505, 696–700. DOI